Introduction
ProkaryMetrics is a software package designed to provide:
- 3D reconstruction and visualization of 8/16-bit B&W fluorescent
microscopy z-stacks
- 3D interaction with the reconstructed data
- manually-assisted annotation of the individuals in microbial biofilms
- visual and quantitative analysis tools to gather quantitative
measurements on individuals as well as the biofilm as a whole
Software Requirements
The software is written in Python (2.7) and requires the following
libraries:
- VTK (the Visualization Toolkit). At least version 5.6.
- wxPython (windowing toolkit). At least version 2.8.10.
- PIL (the Python Imaging Library). At least version 1.1.7.
The simplest means to getting the appropriate Python environment with
the appropriate libraries is to install the Enthought Python
Distribution (free for Academic users) which can be found at:
http://enthought.com/products/epd.php
ProkaryMetrics requires at least version 7.0 to run due to the need for
Python 2.7.
In the near future, I hope to provide a self-contained app package for
Mac/Win that will not require any installations.
Running ProkaryMetrics
Once you have the appropriate Python environment and libraries installed, use
a console to navigate to the ProkaryMetrics folder contained with this file in
the downloaded archive and type:
This command will launch the program, and everything else is done through
interacting with the GUI.
User Interface
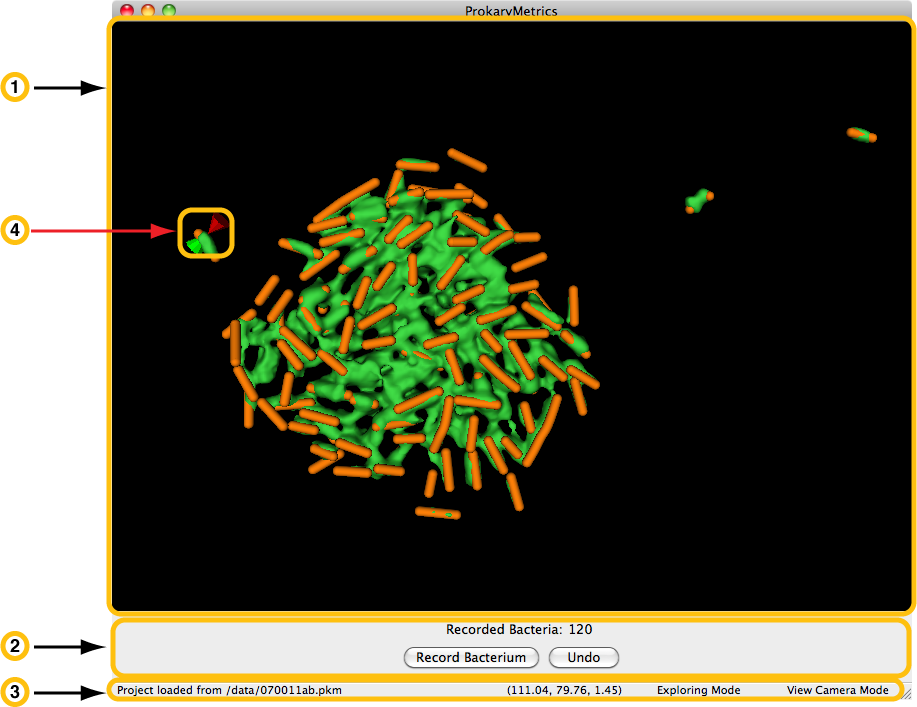
Below is a screenshot of the basic user interface for ProkaryMetrics.
The major interface elements are highlighted, as well as the important
data kept track of at all times.
- Visualization Window - This is the main focus of ProkaryMetrics;
providing the user with 3D visualization of their reconstructed data,
and allowing mouse-interaction for 3D data manipulation and
exploration.
- Actions Panel - This section of the program window provides
the count of bacteria the user has marked, and presents the
option to either save a set of marked points as a bacterium, or
undo the addition of the last recorded bacterium.
- Status Bar - The status bar is divided into four sections. From
left to right: the most recent status message (seen here, the
successful loading of a saved project), the current mouse pointer
location in terms of X, Y, and Z within the rendered data, the
mouse click mode (Exploring allows the user to examine the data by
rotating, zooming, etc..., the other option Recording allows the
user to annotate bacteria), and the camera mode (this feature is
still in testing).
- Mouse Cursor - The red and green cones represent the location of
the mouse, with the clicking tip between the points of the cones.
The two-cones cursor attaches itself to the nearest surface of the
reconstructed data, allowing the user to trace the surface and
thus permit accurate marking of bacteria. Here the cursor is
tracing the surface of a section of the image data (green)
representing a bacterium. The orange data is a user-recorded
marking of the bacterium from the image data.